
by Dr. Josh Hurwitz, senior economist, ARTBA & Dr. Alison Premo Black, chief economist, ARTBA
Federal investment through the Infrastructure Investment and Jobs Act (IIJA) has helped support record levels of highway and bridge construction, despite supply chain issues, rising material prices, and labor costs. As the five-year program, first enacted in November 2021, crosses the halfway point, there is strong evidence of real market growth.
Over the last 30 months, the law’s investment has helped support significant increases in major indicators, including contract awards, highway and bridge contractor employment, and construction activity. ARTBA analysis suggests that there is still a lot of IIJA funding on the horizon. Many projects supported by discretionary grants and the new formula bridge program have yet to enter the construction phase.
Flow of Funds
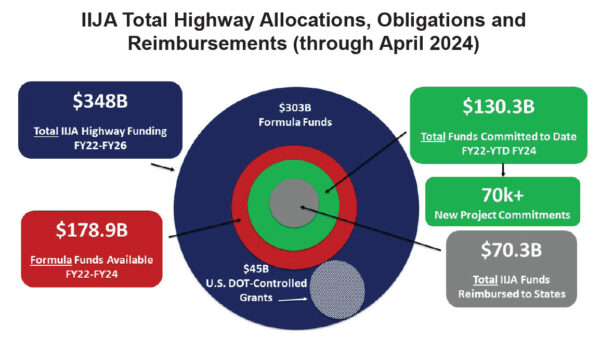
IIJA provides nearly $350 billion in federal highway and bridge funding over five years (FY 2022-2026), split between formula funds ($303 billion) and U.S. Department of Transportation (DOT) controlled grants ($45 billion). The largest step-up occurs in the first year (FY 2022), with total funding levels rising about 40 percent. This annual increase is the third largest in history, surpassed only by two years in the late 1950’s, after passage of the Federal-Aid Highway Act.
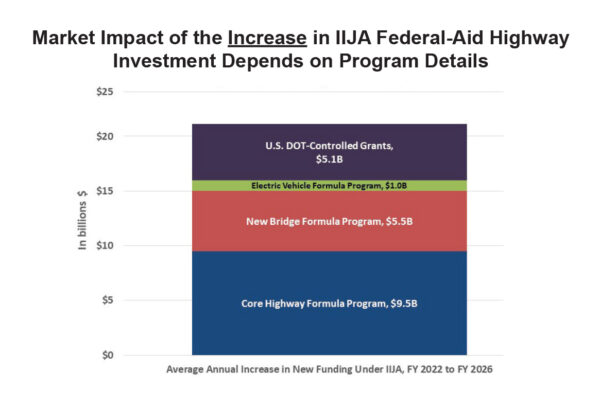
In the later years of IIJA, funding levels rise by about two percent annually, plus any supplemental funding added by Congress during the appropriations process. On average, highway and bridge funding under the new law is about $21.1 billion higher per year than in FY 2021.
To assess the market impact of this increased funding, and expected timing, it is important to decompose the underlying program details. About $9.5 billion of incremental funding per year, or 45 percent of the average $21 billion annual funding increase, represents a top-up to core highway formula programs. States have decades of experience programming these funds and flexibility over the types of projects receiving obligations. Effectively, this funding must also be obligated within the fiscal year it is apportioned, resulting in a prompt entry to the construction pipeline.
New under IIJA is a bridge formula program, which accounts for an additional $5.5 billion (26 percent) of the average annual $21 billion funding increase, and an electric vehicle (EV) formula program, which adds $1 billion (five percent) per year. Congress granted states four years to obligate funding from these programs. As a result, the pace of obligations from these programs has been much slower. At the halfway mark, only about $7 billion of $16 billion (43 percent) in available bridge formula funds and $200 million of $3 billion (seven percent) in available EV formula funds has been obligated.
Finally, the remaining $5.1 billion per year, or 24 percent of the average annual increase in funding, is controlled by the U.S. DOT and administered through a series of discretionary grant programs. This amount includes both growth in existing programs, as well as newly introduced grants.
A large share of this funding has also been slow to obligate. For example, while more than $13 billion in discretionary awards was announced during the first half of IIJA, only about $2 billion had been obligated. A primary source of this lag is the additional time often needed to reach a grant agreement, lengthened under IIJA by the rollout of new programs and learning curve for local agencies directly applying for the first time.
As of April 30, about $130 billion of total IIJA highway and bridge funds had been obligated. This accounts for 73 percent of available formula funds through FY 2024—noting the obligations also include any committed discretionary funds—and 37 percent of total funding through FY 2026.
Of this obligated funding, about $70 billion—or 54 percent—has been spent (i.e., reimbursed to states). At the IIJA halfway point, nearly 80 percent of all available funding (through FY 2026) remains to be spent.
Most obligations and outlays-to-date are from core highway formula funds, which enter the market quickly, driving significant growth. At the same time, a substantial share of the incremental funding under IIJA, including from the new formula programs and discretionary funds, is still waiting on the sidelines and expected to have a longer-term impact.
Market Impacts
There is an obvious connection between the historic increase in federal funding under IIJA and atypical growth in major market indicators, many to record levels:
- New Federal-Aid Highway Formula Fund Projects: There have been more than 70,000 new formula project commitments under IIJA. In FY 2023, the number of new commitments (31,090) was 14 percent higher than FY 2021. Volume growth has occurred across projects of all sizes, including mega projects with federal obligations exceeding $100 million (+75 percent).
- State and Local Government Contract Awards: Both the value (+27 percent) and number (+14 percent) of highway and bridge contract awards experienced record growth in 2022. In 2023, the value and number rose an additional nine percent and four percent, respectively. For perspective, typical growth rates are about four percent and one percent.
- Employment: On a seasonally-adjusted basis, the highway, street and bridge construction industry added nearly 40,000 jobs (+11 percent) over the first half of IIJA. Industry employment surpassed record levels in 2023 and has continued rising since on a year-over-year basis.
- Value Put in Place (VPIP): Given the multi-year project pipeline, the value of construction activity lags the forward indicators (e.g., contract awards). Whereas typical growth in VPIP for highways and bridges averages four percent per year, VPIP rose 10 percent in 2022 and a record 18 percent in 2023. While growth in contract awards has moderated in 2024, now to a significantly higher baseline, VPIP has continued to increase at a 15 percent year-to-date rate. The spend-out of IIJA funds, and related construction activity, is expected to continue rising through the life of IIJA.
The Impact of Inflation
Supply chain issues and other pandemic-related challenges led to spikes in material and labor costs well before IIJA was enacted. Abnormal cost increases for materials persisted through the first year of IIJA but have since moderated, whereas labor costs have continued rising atypically. There is no single price index that can provide a universal inflation adjustment for construction activity. For example, estimates of average annual real growth since IIJA enactment can range from 12 percent, using a composite index of direct material, labor and overhead costs, to -2 percent, using a bid-price index such as the National Highway Construction Cost Index.
ARTBA estimates positive real growth between these extremes—around six to eight percent per year. The evidence for real market growth is overwhelming. It is difficult to reconcile a stagnant or declining market with record increases in both the value and number of contract awards. It is highly unlikely the industry would employ more workers than ever to do less work. The volume demand in state DOT lettings for many major materials has also risen commensurate with ARTBA’s real growth estimates.
Fifty State Markets
Underlying the national totals are 50 different state markets with variation in federal funding priorities, state revenue health, and procurement practices. For example, nearly 80 percent of IIJA-supported project value in Texas is geared towards construction, whereas this share is less than 45 percent in Oregon, which has prioritized more planning and design work. As a result, a contractor in Oregon may have a very different perception of IIJA than a contractor in Texas, even controlling for different program sizes. ARTBA’s public highway dashboard, market intelligence service, and custom economics work is designed to help members analyze this state-level variation.
Midway through the IIJA, the market has achieved new records, despite macroeconomic challenges. While every state is different, IIJA-supported projects have been initiated in nearly every U.S. county. And nearly 80 percent of total IIJA funding remains to be spent.
____________________________________
Sources: Chart on left- Data from U.S. Treasury and the Federal Highway Administration. Project commitments are included if the base year of the award (identified in the U.S. Treasury data). Does not include COVID relief, emergency, or supplemental funds. FY2022 totals include project commitments made using FAST Act extension funds, to provide a full year on year comparison of total projects supported by the federal aid highway program. Total obligations and reimbursements are pooled across both formula and discretionary programs. Chart on right- ARTBA’s IIJA Analysis report, totals may not add up due to rounding and do not include budget authority subject to appropriation from the General Fund. U.S. DOT-controlled grants include project-focused national grants and other programs, such as National Significant Freight & Highway Projects, the Bridge Investment grants, and PROTECT discretionary grants.
Related News
Preventing Deaths in Work Zones Requires a Change in Thinking
by Bradley Sant, senior vice president of safety and education, ARTBA Miguel Luna,…

The Road Ahead: 2024 Federal Legislative, Regulatory and Political Outlook
by Beth McGinn, vice president of communications, ARTBA Baseball legend Yogi Berra once…